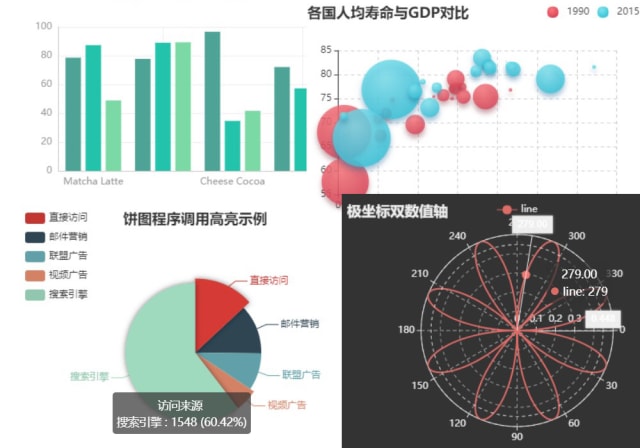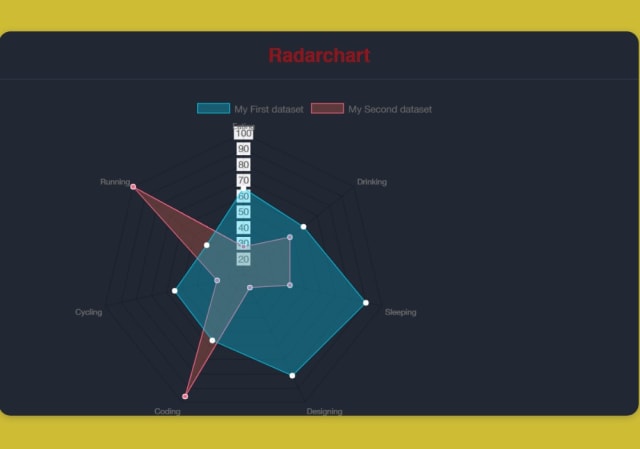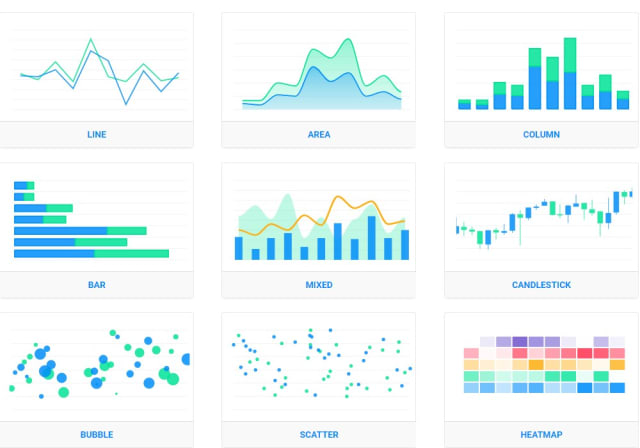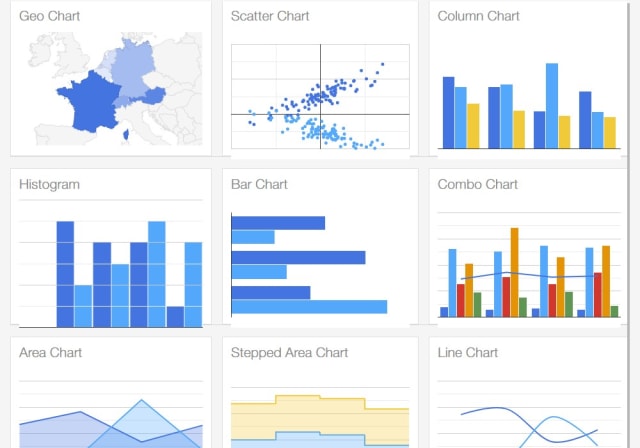
x-chart
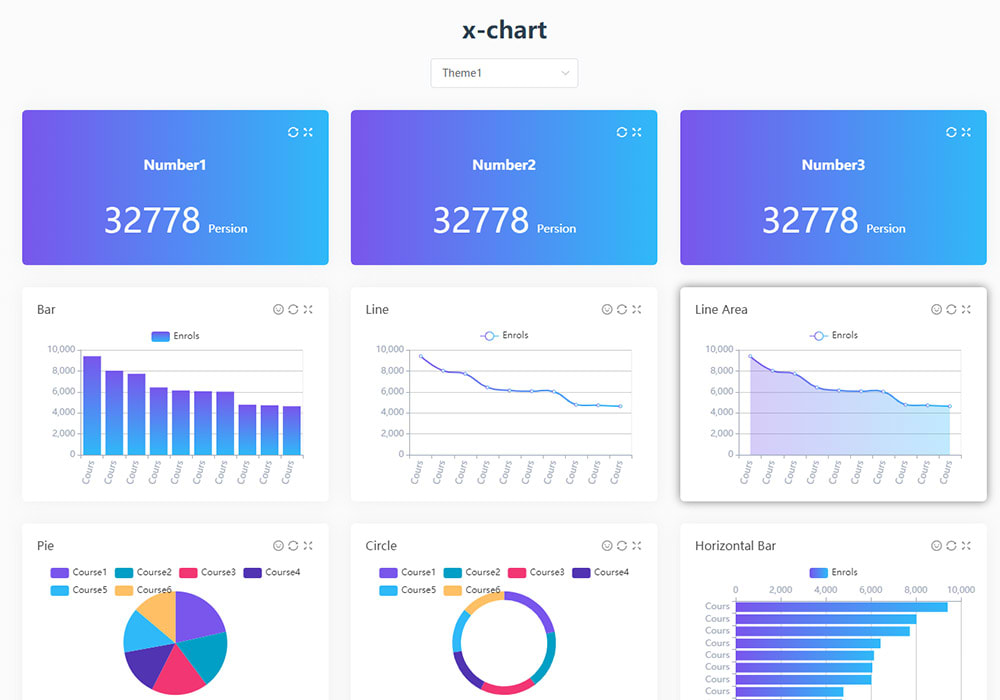
x-chart is a draggable & resizable data visualization system
15K viewsAdded Jan 2, 2019
x-chart is a draggable & resizable data visualization dashboard.
Develop
# clone the project
git clone https://github.com/yugasun/x-chart.git

# install dependency
npm install

# develop
npm run dev

# build
npm run build

# deploy for Github page
npm run deploy

# build docker image
npm run docker:build

# run docker image in container
npm run docker:run
Feature
- Configurable dashboard: all modules render depend on the api.
- Chart modules are draggable and resizable.
- Cache build js and css files in localStorage using bowl.js.
- Customized and beautify charts using echarts.
- Frontend data mock demo using mockjs.
- Docker deploy.
- Refactor with Typescript.